Using Neural Networks in ISIS
 |
Development of an Intelligent Sensing Instrumentation Structure I.S.I.S.
Using Neural Networks in ISIS
|
| Home | The main features | Contradictions | Simulating of drifts | Combination of drifts | Error correction |
|
Simulation modeling
The drift of certain sensors does not allow evaluating possibilities of prediction method as a
whole in some specific exploitation conditions. Therefore, the experimental researches of proposed
sensor drift prediction method were conducted by simulation modeling. The hypothetical data about
sensor drift were used as historical. They are presented as mathematical expressions simulating
various kinds of possible sensor drift. The 10 curves of hypothetical data were formed per each
kind of drift. During researches each from 10 curves is accepted for real sensor drift and the
remaining curves are used for forming of IHDNN training sample. Thus the 10 curves of percentage
errors of historical data integration are received on the basis of 10 curves of hypothetical data.
It is expedient to research integration error since 3
calibration because the first and second calibrations are already executed at moment of data integration.
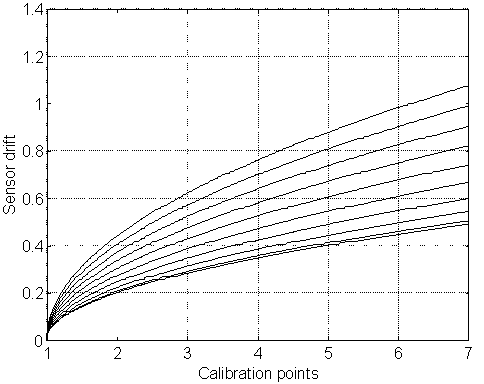
The first set of curves simulating drift "with saturation" is presented on Figure 3.
The drift velocity decreases during exploitation for such sensors. Such kind of drift is simple
and it is possible to use a model of single-layer perceptron with linear neuron's activation
function for data integration. Thus the inputs number of perceptron should correspond to number
of trained data curves. For 10 researched curves the single-layer perceptron has 9 inputs. The
sum-squared error of single-layer perceptron training has made 10Å-5 and the average duration
of training did not exceed 3 seconds on the computer Pentium-II per each curve. The maximum and
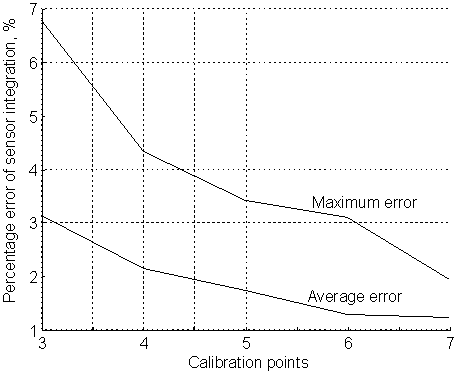
average percentage error of data integration (see Figure 4) did not exceed 7% and 3% accordingly.
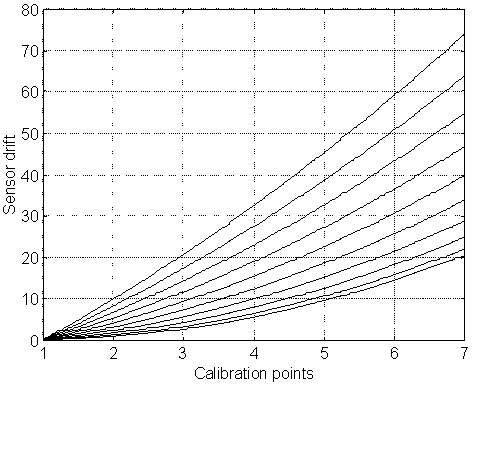
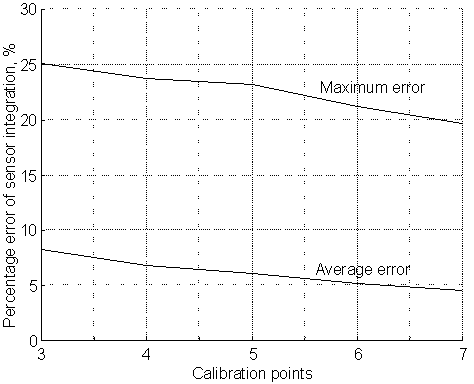
 Figure 3. First set of hypothetical data about sensor drift  Figure 4. Percentage integration error of first set of sensor drift  Figure 5. Second set of hypothetical data about sensor drift  Figure 6. Percentage integration error of second set of sensor drift |